Monitor Xray servers with Telegram alerts
To monitor an Xray server, connect through each inbound with a real client from outside the server, and alert only when the same inbound fails twice in a row. Ping and port checks miss most Xray failures, and the built-in observatory only tests outbounds. Send the alerts to a Telegram group through a bot you control, and add servers in bulk from share links or a subscription URL.
Tahir Mehmood9 min read
I checked the Xray parts of this post against Xray-core v26.11.9, the latest tag on XTLS/Xray-core, and the official docs in Xray-docs-next. The Telegram parts use the Telegram Bot API and Prometheus Alertmanager v0.35.
What can go wrong on an Xray server that a ping misses?
Most of it. A ping proves the host answers ICMP, and a port check proves something accepts TCP on the port. Neither proves a client can finish a handshake and get traffic through. These are the failures I see most:
| Failure | Ping | TCP port check | Real client connection |
|---|---|---|---|
| Xray stopped after a bad config edit | passes | fails | fails |
| Port closed in the cloud firewall | passes | fails | fails |
| REALITY target or keys wrong | passes | passes | fails |
Client UUID or flow changed on the server |
passes | passes | fails |
| TLS certificate expired or not reloaded | passes | passes | fails |
| Server DNS or outbound broken | passes | passes | connects, nothing loads |
| Server IP blocked in the users' country | passes from your host | passes from your host | fails from that country |
The third and fourth rows are the ones that hurt. Xray accepts the TCP connection before it checks anything, so a port check stays green while every client fails. For REALITY problems in particular, see Xray REALITY not working.
What does the Xray observatory check, and what doesn't it?
The observatory checks outbounds, not inbounds. It sends an HTTP request through each matched outbound and records whether it worked and how long it took. Balancers use those results to pick a working outbound.
Xray has two kinds. Both match outbounds by tag prefix with subjectSelector:
observatory |
burstObservatory |
|
|---|---|---|
| Probe URL | probeUrl, default https://www.google.com/generate_204 |
destination, default https://connectivitycheck.gstatic.com/generate_204 |
| How often | every probeInterval, default 10 seconds |
interval on average, default 1 minute, at random times |
| Timeout | 5 seconds | timeout, default 5 seconds |
| Method | GET | httpMethod, default HEAD |
| Keeps | last result | last sampling results, default 10 |
The defaults come from the Xray-core source (app/observatory/observer.go and app/observatory/burst/healthping.go). The docs warn that probing at a fixed interval can be a fingerprint, which is why the burst version probes at random times.
On a server, the observatory is useful when Xray sends traffic on to something else, such as a chained upstream. You can read its results through the metrics listener:
{
  "observatory": {
    "subjectSelector": ["upstream"],
    "probeUrl": "https://www.google.com/generate_204",
    "probeInterval": "1m"
  },
  "metrics": { "listen": "127.0.0.1:11111" }
}
curl -s http://127.0.0.1:11111/debug/vars | jq .observatory
Each outbound shows alive, delay in milliseconds, last_seen_time and last_try_time.
What it never does is connect to your inbounds from the internet. It runs inside Xray, on the server, so it cannot see a closed firewall, a wrong REALITY key or a blocked IP. The same goes for the Stats API. With "stats": {} and the StatsService in the api section, xray api statsquery --server=127.0.0.1:8080 returns traffic counters per inbound, outbound and user. Prometheus exporters read those counters too. Traffic is a good signal (an inbound whose downlink drops to zero at peak hours deserves a look), but it is not a test.
How do I check every inbound from outside?
Run a real Xray client against each inbound from a machine on another network, and fetch a URL through it. That is the only check that fails for the same reasons your users fail.
Keep one client config per inbound in a folder, each with a local SOCKS inbound. Most panels can give you these: the JSON subscription formats in 3x-ui and Remnawave return complete Xray client configs. Then this script tests them all:
#!/usr/bin/env bash
# Test every Xray client config in ./configs through its SOCKS inbound.
set -u
TEST_URL="https://www.gstatic.com/generate_204"
failed=0; total=0
for cfg in configs/*.json; do
  total=$((total + 1))
  port=$(jq '[.inbounds[] | select(.protocol == "socks")][0].port' "$cfg")
  xray run -c "$cfg" > /dev/null 2>&1 &
  pid=$!
  sleep 2
  if curl -fsS -m 15 -o /dev/null --socks5-hostname "127.0.0.1:$port" "$TEST_URL"; then
    echo "OK   $cfg"
  else
    echo "FAIL $cfg"; failed=$((failed + 1))
  fi
  kill "$pid" 2>/dev/null; wait "$pid" 2>/dev/null
done
echo "$failed of $total failed"
[ "$failed" -eq 0 ]
Two details matter. --socks5-hostname makes the server resolve the test URL, so broken DNS on the server fails the check as it would for users. And the test URL should return 204 quickly from anywhere; the real delay test post explains why the URL choice matters.
Run it from a provider other than the one your servers use. If your users are in one country, a check from that country is worth more than three from elsewhere. For a single link by hand, the free tester runs the same kind of handshake.
How do I send alerts to Telegram?
Create a bot, add it to a group, and send messages to that group's chat ID. Every tool that alerts Telegram needs the same two values: the bot token and the chat ID.
- Message @BotFather, send
/newbot, and copy the token it gives you. - Create a group for alerts, add the bot, and send any message in the group.
- Read the chat ID from the bot's updates:
curl -s "https://api.telegram.org/bot$TG_TOKEN/getUpdates" \
  | jq '.result[].message.chat | {id, title}'
Group IDs are negative, and supergroup IDs start with -100. If getUpdates returns an empty list, send another message in the group and run it again. Then check delivery:
curl -fsS -o /dev/null "https://api.telegram.org/bot$TG_TOKEN/sendMessage" \
  --data-urlencode "chat_id=$TG_CHAT" --data-urlencode "text=test from the checker"
If you already run Prometheus, Alertmanager (0.24 and later) has a Telegram receiver:
receivers:
  - name: telegram
    telegram_configs:
      - bot_token_file: /etc/alertmanager/telegram_token
        chat_id: -1001234567890
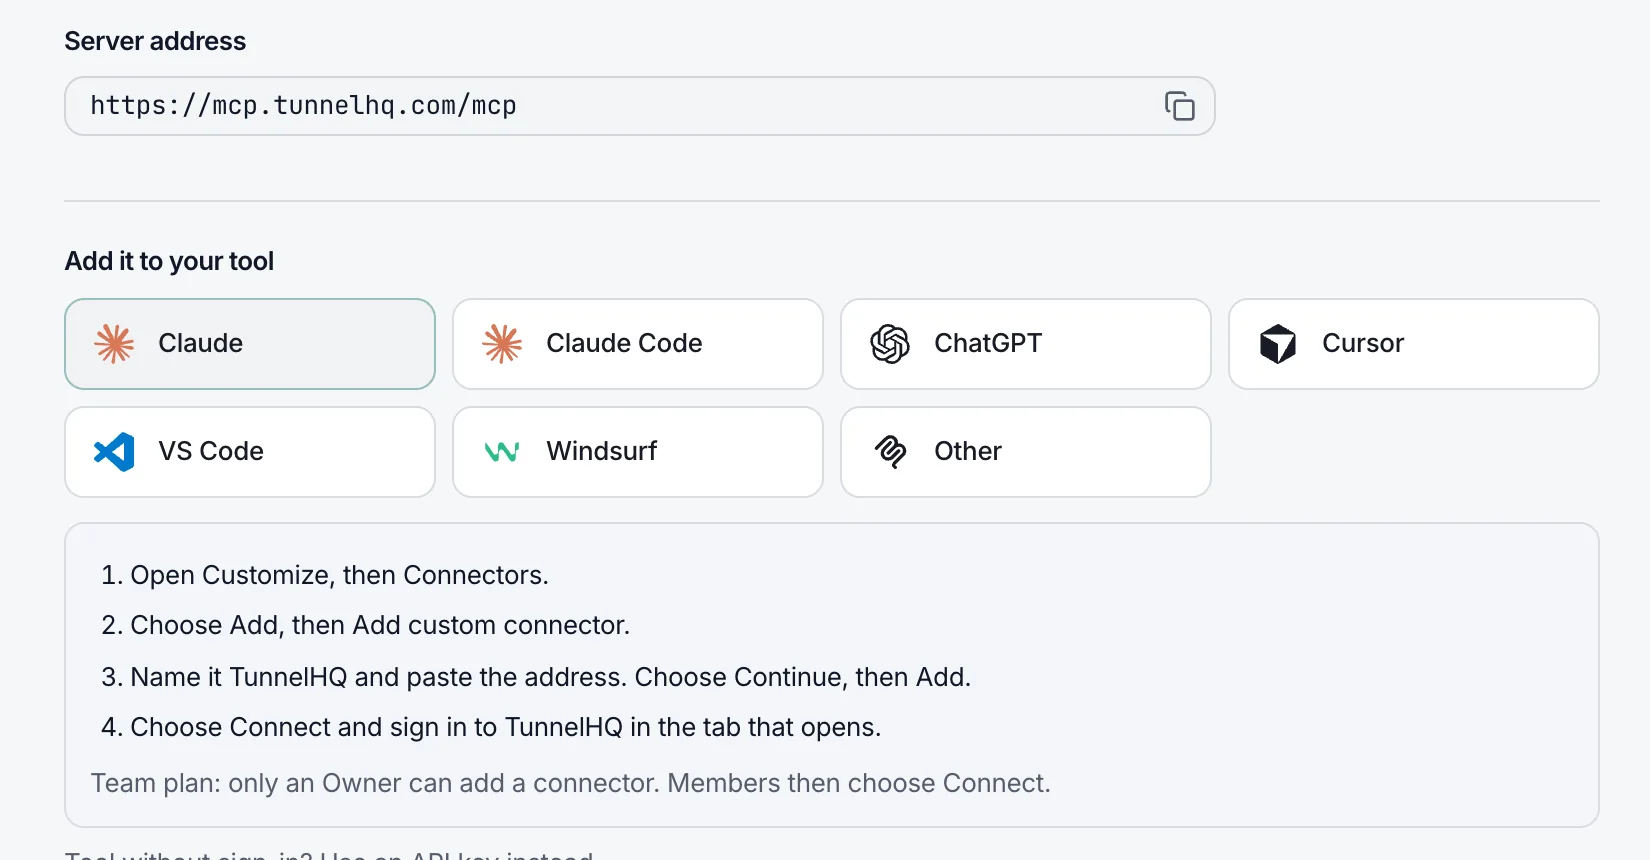
In TunnelHQ, go to Integrations, click Add Integration, choose Telegram, and paste the bot token and chat ID. Leave Enable for all monitors in this project on, save, and click Send Test on the card. Telegram is one of 20 alert channels, and the alert channel docs cover the rest. Free includes 1 channel, Starter 5, and Pro and Business unlimited.
How do I stop alerts on every short flap?
Alert on the second failure in a row, not the first, and always send the recovery. A single failed check is often the network between your checker and the server, not the server.
For the script above, keep a count per config between runs and send Telegram only when it reaches 2:
state="state/$(basename "$cfg").fails"
if [ "$ok" = 1 ]; then
  [ "$(cat "$state" 2>/dev/null || echo 0)" -ge 2 ] && tg "RECOVERED $cfg"
  echo 0 > "$state"
else
  n=$(( $(cat "$state" 2>/dev/null || echo 0) + 1 )); echo "$n" > "$state"
  [ "$n" -eq 2 ] && tg "DOWN $cfg (2 failed checks in a row)"
fi
Here tg is a small function that wraps the sendMessage call above. With Alertmanager, the same idea is the for: duration on the alert rule, set to at least two check intervals.
In TunnelHQ this is the monitor's Retries setting, 2 by default, from 1 to 10. The first failed check opens a Degraded incident and sends nothing. If the next check fails too, the monitor goes Down and the alert goes out. If it passes, the incident closes quietly. Only Down and recovery send alerts; Degraded and Unknown don't. A monitor that tests from several countries also has a Notify on partial outage switch, off by default, so one country failing alone doesn't page you unless you want it to. Over the API, the field is maxretries. Details are in the monitor docs.
If you want to hear about a long outage more than once, Repeat the alert sends it again every 10 minutes, 30 minutes or hour, up to 4 more times, until someone acknowledges the incident.
How do I add 50 servers at once?
Paste all the share links at once, or point the monitor at a subscription URL that already lists them. Adding them one by one is where mistakes creep in.
| You have | Use | Notes |
|---|---|---|
| A list of share links | Add tunnel, Bulk import, Paste Text | vless://, vmess://, trojan://, ss://, hysteria2://, tuic://, mixed, up to 100 KB of text per paste |
| A subscription URL | paste it into Add tunnel | servers follow the subscription; Starter 3 URLs, Pro 10, Business unlimited |
| A script or CI job | thq servers create in a loop |
one monitor per link |
The paste preview marks each row ready, needs input or cannot import, and only ready rows are imported. The import docs cover every option.
A subscription is the better choice when servers come and go. TunnelHQ tests every config behind it at each sync, every 5 minutes to every 24 hours, adds monitors for new servers, and pauses the monitors of servers that leave the list. Use a dedicated monitoring user with no expiry and no traffic limit, so its links never fail for billing reasons. Monitoring V2Ray subscription URLs covers the pitfalls.
From a script, with one share link per line in links.txt:
while IFS= read -r link; do
  thq servers create "$link" --name "${link##*#}"
done < links.txt
The name is the text after # in each link. New monitors use every active alert channel in the project, so the Telegram integration applies to all 50 without extra steps.
Two numbers to check before you start. Each inbound is its own monitor, so 50 servers with two inbounds each is 100 monitors: Starter has room for 20, Pro 100 and Business 500. And the check interval depends on the plan: every 5 minutes on Starter, 2 on Pro and every minute on Business. On Pro and Business you can also pick the countries a monitor tests from. The VLESS monitoring page shows what a check does, and the integrations page lists every alert channel. Every plan has a 14-day free trial.
A monitoring plan for an Xray fleet
| What | How | How often | Alert when |
|---|---|---|---|
| Every inbound | real client connection from outside | 1 to 5 minutes | the same inbound fails twice in a row |
| Subscription | fetch and count the links | 5 to 15 minutes | not 200, or fewer links than expected |
| Outbounds and upstreams | observatory results from /debug/vars |
1 minute | an outbound not alive |
| Traffic | Stats API counters | 5 minutes | an inbound's traffic drops to zero at peak hours |
| Certificates | openssl s_client on TLS inbounds |
daily | less than 14 days left |
The first row catches the most, and it is the one that needs a checker outside your network. The VPN server monitoring guide covers what else a server needs watching.